


What Is VIX-75?
According to Deriv (A broker that hosts VIX-75), VIX-75 is a simulation of real-world market movements. This means that VIX-75 is an ideal trading instrument since it is available 24/7 and is not affected by global events, or market and liquidity risks.
But without a strategy, you’re almost guaranteed to lose 90% of your trading capital within 90 days of trading. This is why Forex Made Simple is bringing you this simple but very effective VIX-75 trading strategy. Get ready to take notes and learn this valuable information that will impact your trading journey in a very positive way.
How VIX-75 Moves.
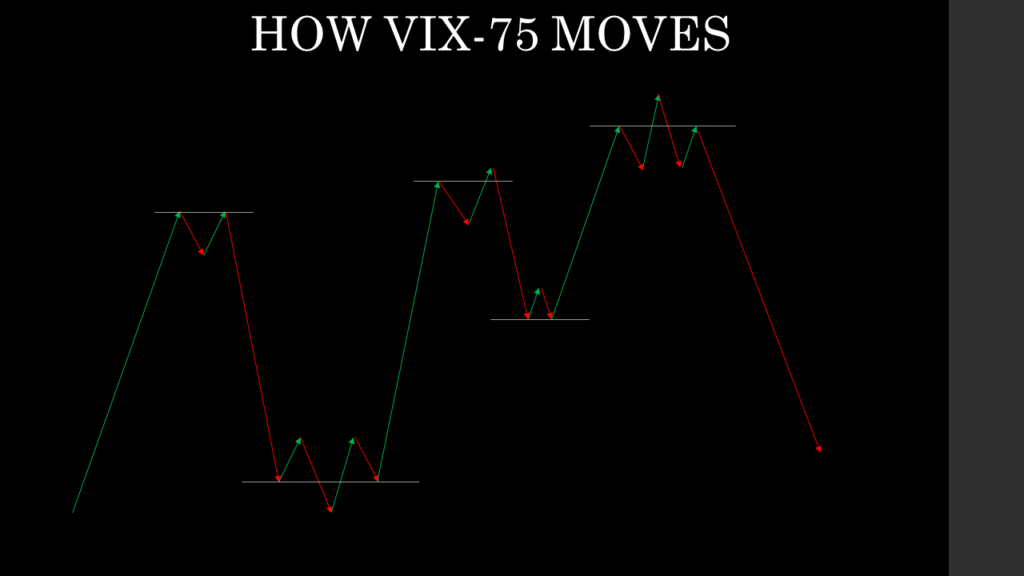
VIX-75 is a highly volatile index, this means there’s a lot of trading opportunities every day on this index. And the good news is that there are recognizable patterns within the movements that VIX-75 makes. For this strategy, we will focus on reversal patterns since they are easily recognizable even for a beginner trader like you. As you can see from the picture, VIX-75 moves in waves, which forms uptrends and also downtrends. And the magic happens when you pay attention to how VIX-75 changes from one trend to another, this is where money is milked from VIX-75. The patterns that VIX-75 makes before changes from one trend to another are called Reversal Patterns. These are very important for technical trading as a whole not just for VIX-75, so you will have to learn them thoroughly. But don’t worry, FMS will guide you through this.
Reversal Patterns
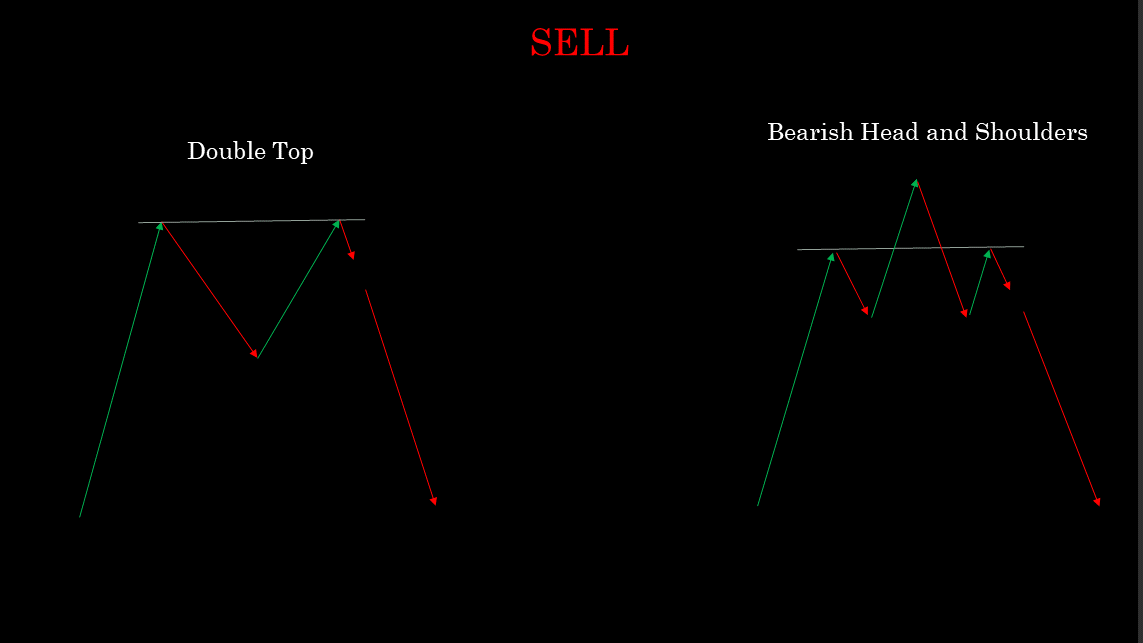
Reversal Patterns are alerts from the market shouting “pay attention to me, I’m about to reverse”. So your job is to take the message that the market is telling you. For this strategy, we will focus on 4 patterns, Double Top, Double Bottom, Bearing Head and Shoulders, and Bullish Head and Shoulders. In truth, these are just two patterns since Double Bottom is just an upside-down Double Bottom and Bullish Head and Shoulder is just an upside-down Bearish Head and Shoulders. The easy way to spot these patterns is to identify Double Top as forming the shape of a letter “M” and Double Bottom as “W”, a head and shoulders pattern looks like a person’s head and shoulders.
The Strategy
Double Top and Bearish Head and Shoulders signal a switch from uptrend to downtrend. We will call these “Bearish Reversal Patterns”. And Double Bottom and Bullish Head and Shoulders signal a switch from downtrend to an uptrend. We will call these “Bullish Reversal Patterns”. Quick tip, “Bearish” is associated with a downtrend movement, and “Bullish” is associated with an uptrend movement. Hence Bearish Reversal Patterns signals a SELL and Bullish Reversal Patterns signals a Buy.
Entry Types
These patterns are more visible and reliable on the 5 Minutes timeframe (5M) and 15 Minutes timeframe (15M).
Double Top
After spotting the first top, a line must be drawn above the top as an anticipation for the second Top. Then you should wait for the second top as shown in the picture below.
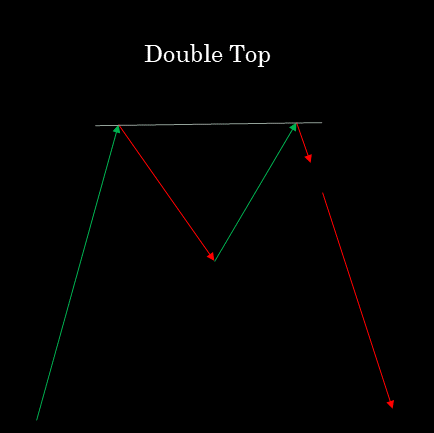
After the second top is spotted, wait for the market to make a small turn to the downside then place a SELL entry. This is usually the second RED candle.
Double Bottom
After spotting the first Bottom, a line must be drawn below the Bottom as an anticipation for the second Bottom. Then you should wait for the second bottom as shown in the picture below.
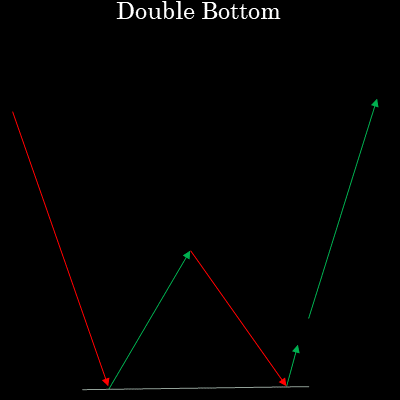
After the second Bottom is spotted, wait for the market to make a small turn to the upside then place a BUY entry. This is usually the second Green candle.
Bearish Head and Shoulders
After spotting the Left Shoulder and a Head is spotted, a line must be drawn above the Left Shoulder as an anticipation for the Right Shoulder. Then you should wait for the Right Shoulder as shown in the picture below.
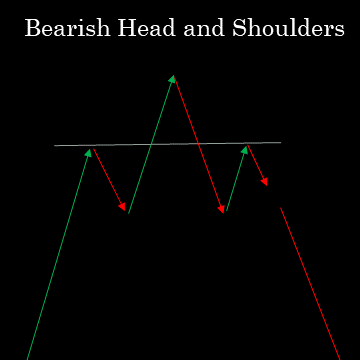
After the Right Shoulder has appeared, wait for the market to make a small turn to the downside then place a SELL entry. This is usually the second RED candle.
Bullish Head and Shoulders
After spotting the Left Shoulder and a Head is spotted, a line must be drawn below the Left Shoulder as an anticipation for the Right Shoulder. Then you should wait for the Right Shoulder as shown in the picture below.
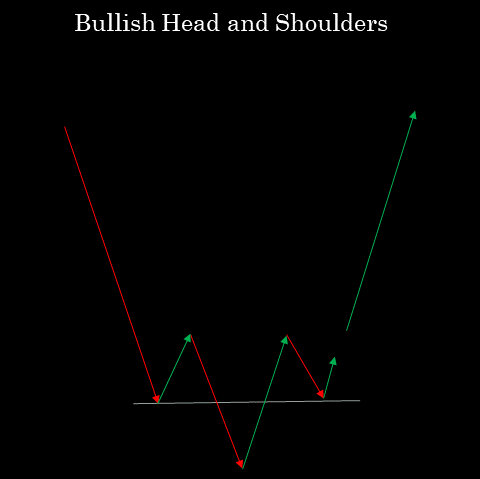
After the Right Shoulder has appeared, wait for the market to make a small turn to the upside then place a BUY entry. This is usually the second GREEN candle.
The 3 RULES
- Put your emotions aside.
- Never Trade without a stop loss.
- Always move SL to break even after you’re in profit.


I have been absent for some time, but now I remember why I used to love this website. Thanks , I抣l try and check back more frequently. How frequently you update your site?
After examine a number of of the blog posts on your web site now, and I actually like your method of blogging. I bookmarked it to my bookmark web site record and will probably be checking back soon. Pls take a look at my website online as nicely and let me know what you think.
Wow! Thank you! I continually needed to write on my site something like that. Can I take a part of your post to my site?
There’s noticeably a bundle to know about this. I assume you made sure nice points in options also.
The very crux of your writing whilst sounding agreeable at first, did not settle properly with me personally after some time. Someplace within the sentences you actually managed to make me a believer unfortunately just for a very short while. I nevertheless have got a problem with your jumps in logic and one would do well to help fill in all those gaps. If you actually can accomplish that, I could surely end up being impressed.
Heya! I’m at work surfing around your blog from my new iphone! Just wanted to say I love reading through your blog and look forward to all your posts! Keep up the superb work!
With havin so much content do you ever run into any issues of plagorism or copyright infringement? My website has a lot of completely unique content I’ve either created myself or outsourced but it seems a lot of it is popping it up all over the web without my agreement. Do you know any ways to help protect against content from being ripped off? I’d truly appreciate it.
I have observed that over the course of constructing a relationship with real estate managers, you’ll be able to get them to understand that, in every single real estate purchase, a fee is paid. In the end, FSBO sellers don’t “save” the commission payment. Rather, they fight to win the commission by means of doing the agent’s task. In completing this task, they expend their money along with time to conduct, as best they will, the duties of an representative. Those assignments include exposing the home by way of marketing, presenting the home to willing buyers, constructing a sense of buyer emergency in order to induce an offer, organizing home inspections, managing qualification inspections with the lender, supervising repairs, and aiding the closing of the deal.
My brother recommended I may like this blog. He was totally right. This publish actually made my day. You can not imagine simply how a lot time I had spent for this information! Thanks!
I ‘m pretty sure that you are so obsessive in your opinion on purpose.
Thank you for writing this article. I appreciate the subject too.
magnificent put up, very informative. I ponder why the opposite
specialists of this sector don’t understand this. You should proceed your writing.
I’m sure, you have a great readers’ base already!
You’ve made some good points there. I looked on the web to find out
more about the issue and found most individuals will go along with
your views on this site.